


2017 Annual Statistics Report by Japan Patent Office
On June 29, 2017, the Japan Patent Office (JPO) released the JPO Annual Report 2017.[1] The JPO Annual Report provides a comprehensive compilation of statistics on Japanese intellectual property (IP) and detailed explanations of the JPO’s recent developments on the IP system in Japan. In our newsletter of July 2016, we reported on trends of the IP5 patent filings with statistical data provided in the JPO Annual Report 2016. In the current article, we will update our previous report by highlighting some of the important features of patent statistics from the JPO Annual Report 2017.
(1) Chinese patent applications continue to rise
As reported in our newsletter of July 2016, the number of patent applications filed in China has been significantly increasing in recent years. In 2016, patent applications filed with the State Intellectual Property Office of the People’s Republic of China (SIPO) increased approximately 21.5% from the previous year, reaching 1.3 million patent applications, as shown in FIG.1 below, reproduced from the JPO Annual Report 2017 (FIG.1-1-17).[2]
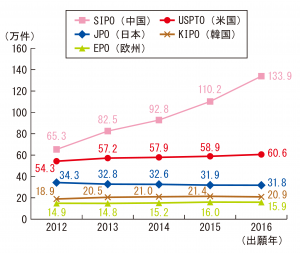
FIG. 1
In 2016, the number of Chinese patent applications was about 2.2 times greater than that of the United States and about 4.2 times greater than that of Japan. Therefore, China continues to maintain its momentum of rapid growth and has contributed significantly to the increasing number of global patent filings.
(2) Japanese patent applications slightly fell again in 2016
As explained in our previous newsletter, Japan has a long-term trend of decreasing patent filings, unlike the trends of patent filings at the other major patent offices.
In Japan, the number of patent applications has gradually decreased over the past decade. According to the JPO Annual Report 2017, 318,381 patent applications[3] were filed with the JPO in 2016, with a decrease of approximately 0.1% from the previous year. Thus, although the decreasing trend persisted in 2016, the decrease was relatively small.
In contrast, the patent allowance rate at the JPO has significantly increased in the past years. According to the Annual Report 2017, the allowance rate further improved and reached 75.8% in 2016. Interestingly, as shown in FIG.2 below, an inverse trend can be seen between the allowance rate and the number of patent applications filed with the JPO.
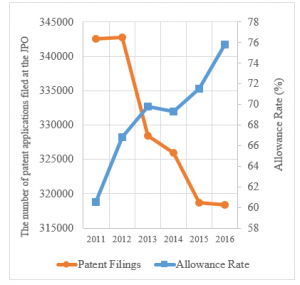
FIG. 2
Although the total number of patent applications originating from Japan has not significantly changed since 2012, the number of PCT applications filed with the JPO has steadily increased. According to the JPO Annual Report 2017, 44,495 PCT applications were filed with the JPO in 2016, an increase of approximately 3.2% over the previous year’s filings.
In 2016, Japanese applicants filed 85,313 patent applications with the USPTO (a decrease of approximately 1.2%), 39,207 patent applications with the SIPO (a decrease of approximately 2.2%), 21,007 patent applications with the EPO (a decrease of approximately 1.9%), and 14,773 patent applications with the KIPO (a decrease of approximately 3.3%). This data suggests that Japanese applicants primarily file foreign patent applications in the United States.
(3) Approximately 1,200 post-grant oppositions were filed in Japan in 2016
According to the JPO Annual Report 2017, 1,214 cases of post-grant oppositions (PGO) were filed in Japan in 2016. The JPO abolished the PGO system in 2003, but it was reinstated in 2015. Under the previous PGO system in Japan, at least 3,000 PGO cases were filed every year. Therefore, the number of PGOs filed under the new system is significantly less than the PGOs filed under the old system.
Further, in 2016, the average examination period for PGOs was 5.8 months, which is shorter than the average examination period for invalidation trials (10.5 months). However, the JPO noted that the average period for PGOs was relatively short in 2016 because the PGO system was reintroduced in 2015 and many decisions of revocation, which require a much longer time than decisions of maintenance, were excluded in the calculation of the average. Therefore, next year’s calculated average examination period for PGOs may be longer.
(4) Summary
From a global perspective, Chinese patent applications, most of which are filed by Chinese applicants, are the most significant contributor to the total number of global patent filings. On the other hand, Japanese patent applications, most of which are filed by Japanese applicants, are gradually decreasing, notwithstanding an improving allowance rate, suggesting that Japanese applicants are filing patent applications more selectively than ever before.
[1] https://www.jpo.go.jp/shiryou/toushin/nenji/nenpou2017_index.htm (Japanese only). See also JPO Status Report 2017 (English).
[2] The x-axis represents years and the y-axis represents the number of patent applications (1=10,000 applications).
[3] This number is a sum of domestic patent applications and national phase applications filed with the JPO.